Wednesday, May 22, 2013

Unit 5 Day 3 Blog


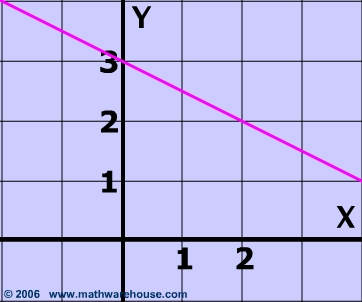
the y-intercept is B in mx+b. The y-intercept is crucial to an equation. The y is how much something cost or where it starts at zero on the x intercept.


FINDING Y

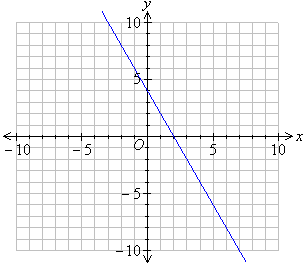
First the slope. To find slop you subtract x from x and y from y.
example: (2,4) (5,6)  2-5=(-3)   4-6=(-2)  the slope would be y/x so -2/-3


the slope here would be -2/-3
the points are different but the slope is the same


the y intercept is 3; that is where the line crosses the y axis


  1. find slope
  2. find y intercept
  3. make an equation
Answer key
2/3
5
y=.666+5

Unit 5 Day 4


this is line equalities
y<5 data-blogger-escaped-p="">y&gt;-1+3/1
for red and blue lines
What you do to solve line inequalities is graph the two lines and shade in where y goes.

  1. find the equation

answer
y&gt;6/3-6


Tips From The Pros


Thursday, May 16, 2013

Day 5

Daily Objective: Students will be able to write an equation of a line given data points.

  1. find the slope
  2. find the y-intercept 
  3. graph the equation


answer key

-5/2x
4

The equation of this line is Y= 6/2 X -5.
You get this, by taking the points 2,1 and 4,7.
X1-X2 under Y1-Y2, so 2-4=-2 and 1-7=-6, -6/-2.
Switch to make it 6/2. So far, the equation is Y= 6/2 X + B.
You get B by finding the line crossing the Y-axis.
To find this, you can take the two points and graph them with
the slope. In this case, you get -5 as B.
Equation: Y=6/2X -5.

Tuesday, May 14, 2013

Day 1

Daily Objective: Students will use the line of best fit to find the equations of lines.
This is a Line of Best Fit.  To find one, you need to find the line that connects the most points.  Then you draw a straight line connecting these points. 


The Line of best fit is a line on a scatter plot that connects the most points while staying straight.

Quiz:
Question 1: Graph a line of best fit on a graph with the points 0, 10 3, 24  7, 54 10, 82 and 12, 96.
Question 2: Graph a line of best fit on a graph with the points  0, 5  2, 16  5, 34  7,  52 and 10, 103
Question 3: Graph a line of best fit on a graph with the points 0, 12  4, 30  8, 62  10,  66 and 11, 89

Answer Key:
Q 1:
Top=# 2 Middle=# 3 Bottom=#1 of Answer Key. Graphs should look like this.

Day 2

Objective: Students will use the line of best fit to find the equation of lines.
Line of Best Fit is a straight line that best represents the data on a scatter plot.

   Chart
X         Y
0           3
 1          6
 2          9
 3          12
 4           15
                                      x y        x  y

Take 2 points, let's say 1,6 and 4,15.
y-y
x-x, so                                6-15= -9 % -3/-1, 3/1 = Slope of line of best fit
                                            1-4= -3
So, y=3/1 X + 3 is your equation of this line. 

Example: 

In a linear equation, there is a pattern in the lines.
All of the points connect in a straight line. 
Quiz: 
Question 1: What is the equation of a line that goes through the points 3, 10 and 8, 20?
Question 2: What is the equation of a line that goes through the points 1, 11 and 5, 55?
Question 3: What is the equation of a line that goes through the points 4, 30 and 8, 50?


Answer Key:
Q 1: y10 -y 20= -10
                                                               x3 -x 8= -5      Slope= 2/1 
Equation = Y= 2X + 4. You get 4 by putting 2 in the equation. 3x2=6, + 4= 10. You get 3, 10
Q 2 : y11 - y 55=  -44
         x1 - y 5= -4         reduce= 11/1 
Equation= Y= 11x 
Q 3 : 30 - 50= -20 
          4 - 8= -4   Reduce= 5/1
Equation= Y= 5x + 10. You get 10 from 4x5= 20, + 10= 30. 4, 30.